Mr. Kumar Sarangapani
The year 2020 has been tumultuous to the entire country with the threat of the
century with COVID19 in all fronts of economy, livelihood uncertainty & chaos
which is continuing with the backdrop of second wave that has happened in the
some of the western countries despite the availability of vaccines which started
giving faint optimism. Of course, it would take quite a while for achieving herd
immunity followed & longer for eradication.
While COVID still continues to be a fear even after reasonable level of decline
in the Asian Countries, there is a looming somewhat slow but almost permanent
threat which has still not been addressed seriously as the situation is being
viewed for the year 2050. It is to be noted that unlike COVID this would be a
gradual regression without a tangible solution and the persistent long-term
strategy being continuously monitored and implemented. The principal drivers
are as under:
844 million people lack basic drinking water access, more than 1 of every 10
people on the planet. By 2050, at least 1 in 4 people will likely live in a country
affected by chronic or recurring fresh-water shortages. 2.3 billion people live
without access to basic sanitation.
780 million people lack basic drinking water access, more than one of every 10
people on the planet.
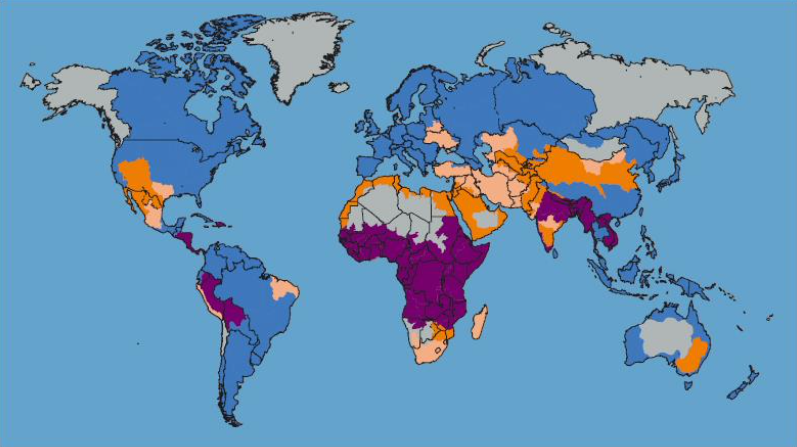
India ranks in one of the most water stressed countries as of as of the year 2012
in the colour coded map as under:
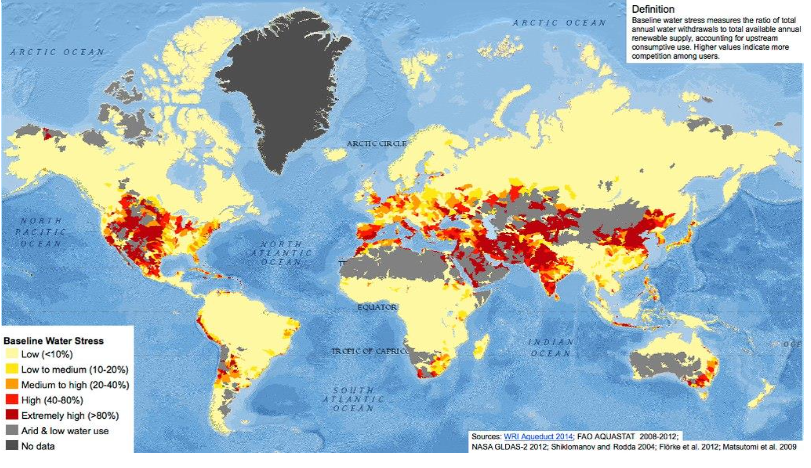
The current latest situation of Water Stress global mapping in the year 2020 is as under which covers the complete states in India which is nearing the brown mark of course not the dark brown which is a water emergency :
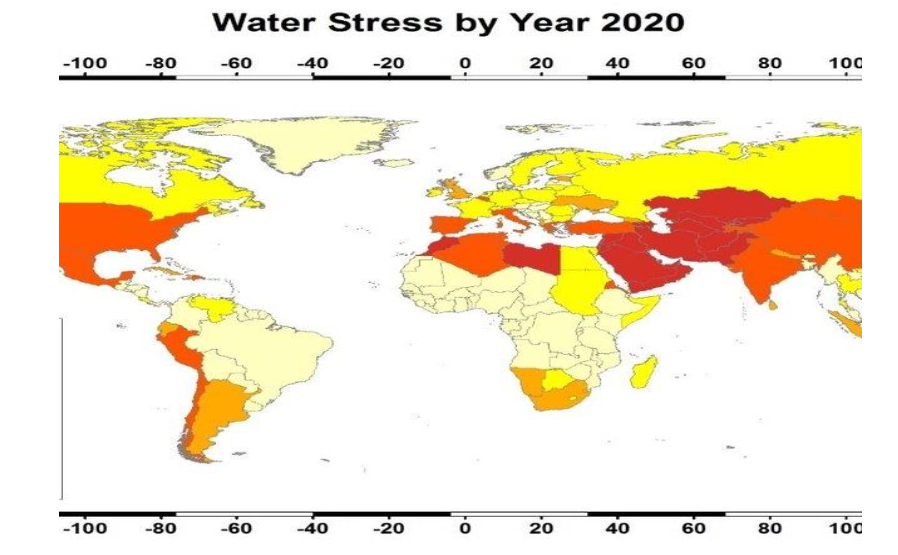
A look at the 2050 map under the current status quo mode (without strict water management & water audit mode) will make the country into a water emergent situation as under:

5 Countries Most Threatened by Water Shortages
- Libya. Libya’s troubles are twofold in that it is undergoing a period of political upheaval while also suffering from lack of water and other resources. …
- Western Sahara. …
- Yemen. …
- Djibouti. …
- Jordan
By the year 2040 there will not be enough water in the world to quench the thirst of the world population and keep the current energy and power solutions going if we continue doing what we are doing today. … By 2050, 1 in 5 developing countries will face water shortages (UN’s Food and Agriculture Organization).
If monthly, rather than annual, variability is considered, 3.6 billion people worldwide, slightly less than 50% of the global population, presently live in potential water-scarce areas at least 1 month per year. This number will increase from 33 to 58% to 4.8 to 5.7 billion by 2050.
Total Renewable Internal Freshwater Resources
SN Country
- 1 Brazil
- 2 Russia
- 3 Canada
- 4 United States
Total renewable water resources (km3) 8,233
4,067
3,300
3,069
Eight Countries that wastes the most water during use
- China – 362 trillion gallons.
- United States – 216 trillion gallons.
- Brazil – 95 trillion gallons.
- Russia – 71 trillion gallons.
- Mexico – 53 trillion gallons.
- India – 30 trillion gallons.
- England – 20 trillion gallons.
- France – 20 trillion gallons.

Global data & facts on water
Water on Earth is essentially salty, and it is the evaporation of this water on the
oceans that mainly feeds the great water cycle, through evaporation,
condensation and precipitation, whose thermal engine is solar radiation. This
cycle supplies water to the continents and breaks down into blue water flowing
in rivers and groundwater, and green water, which is stored in the soil after rain
and is recovered and transpired by vegetation. These flows are almost entirely
used by natural continental and coastal ecosystems, as life has developed
everywhere to the limits of available resources. Globally, the share of this
resource consumed by humanity is still modest: 7% of blue water and 9% of
green water, but the spatial distribution of the humanity is not consistent with
the spatial distribution of water resources: 21.5% of humanity is concentrated in
steppes and arid zones with only 2% of the planet’s blue water resources. In
addition, water needs are increasing due to population growth and changes in
food habits, while water resources are being affected by climate change. How to
solve this challenge of balancing supply and demand in 2050, and a fortiori in
2100, by avoiding, if possible, shortages, famines, bloody conflicts, and
migration?
Just How much water do we have in the world?
The planet Earth was, at the time of its formation, initially anhydrous or low in
water, which had accumulated in the Jovian planets further from the sun, and in
the comet belts (Oort cloud and Kuiper belt); the Earth received most of its
water during the first hundreds of millions of years of its existence, and is
proportionally the richest in water of the telluric planets (Mercury, Venus, Earth
and Mars). The European Space Agency’s Rosetta mission, which sent
the Philae probe on November 12, 2014 to land on the comet 67P/Churyumov-
Gerasimenko and measure in particular the content of Deuterium in its ice:
twice as rich in this isotope of hydrogen as water from the Earth; this type of
comets (at least) cannot therefore be at the origin of terrestrial water, instead,
the eyes turn to a bombardment by rocky or ferrous asteroids also containing a
little water.
Water on Earth is 97% salty, it is its evaporation by solar radiation that feeds
the great water cycle, by condensation and precipitation. In this way, 113,000
km3/year are brought to the continents, an enormous volume (1270 times the
volume of Lake Geneva) that is broken down into blue water, the one that falls
and flows into rivers and aquifers (32%), in green water, that stored in soils
after rain, taken up by roots and transpired by vegetation (65%) and 3%
in merge water from icebergs (Hoekstra and Mekonnen, 2012). Our water
resource is essentially these inputs from the great water cycle.
Global warming (read the climate machine) will accelerate this cycle and on
average increase precipitation while displacing climate zones towards the poles,
causing an aridification of Mediterranean latitudes: 110 million hectares (ha)
cultivable in these latitudes should be lost, but 160 million ha should be won in
northern latitudes (Canada, Siberia) by warming. The frequency of extreme
events (floods, droughts) is also expected to increase. In France, a 10 to 20%
decrease in precipitation is expected by the end of the century, mainly in
summer.
Men currently consume 7% of the blue water flow, but withdrawals are higher
(13%), the consumed part (mainly irrigation water) evaporates and returns to the
atmosphere; the unused part remains liquid, infiltrates, and returns to
groundwater and rivers. We use 9% of the green water for agriculture, the rest
goes to natural ecosystems (forests, savannahs, wetlands). We also take a
little of fossil water from the stocks contained in the large aquifers of a few
countries (India, United States, China, China, Pakistan, Iran, Mexico) at a rate
of about 100 km3/year, but this situation is not sustainable, the stocks of these
aquifers will be depleted in a few decades, requiring the collection of water by
channels in the large Himalayan rivers or in other water-rich sites. The fusion
of high mountain glaciers due to the overheating of some rivers from the Alps,
Himalayas, Rocky Mountains, and especially the Andes Cordillera, where cities
like La Paz and the Pacific coast of Peru now live mainly on these melting
waters, which will have dried up in less than 30 years.
The quantity of domestic water, a definition of which can be used ranges from
20 to 500 l/day per person, on average 300 l/d, or 110 m3/year per person. In
France, it is estimated at 150 l/day. In 2050, the world population world
population should increase to 9.5 billion* and to 11 billion in 2100, with
worrying growth mainly in Africa (1 billion in 2000, 2.5 billion in 2050 and 4.2
billion in 2100). With 250 l/d, the total amount of water needed for the planet in
2050 would represent 870 km3/year, or 0.8% of precipitation, or 2.4% of blue
water. Domestic water is therefore not a problem of quantity, but only of
transport and quality, so of supply and treatment infrastructure. The planet will
never have a shortage of domestic water if it builds these infrastructures in time.
The city of Windhoek (350,000 inhabitants), the capital of Namibia in the
middle of the desert, has been supplied with water for 30 years by a dam and an
800 km long pipe, as well as by the recycling of its treated wastewater, which is
re-injected into the local groundwater… !
Due to a lack of cultivable land or water: their population has exceeded the
country’s capacity to feed them from local resources, and eating habits have
changed; they have to import food from countries with surplus production
(North and South America, Australia, Thailand, France). More than 30% of the
food produced on the planet is now transported from one country to another,
mainly by boat; it is referred to as virtual water, because water-deficit countries
balance this deficit not by importing water, but food, which required water to be
produced.
Importing countries, to pay for these imports, sell energy or mineral raw
materials, have industrial or tertiary activities, tourism, or have financial returns
from the emigrant diaspora. Some countries export high-value agricultural
products (coffee, cocoa, cotton) and import food. But importing countries are
then dependent, with the risk of political pressure and price pressure in the event
of a global shortage. Food autonomy is impossible to achieve today for all
countries in the arid zone (North Africa, Middle East) and tomorrow for the
whole of Asia, due to the lack of arable land. We see countries like China
buying important farmland in developing countries (especially Africa and South
America) to grow their own crops and then import the food they need into their
countries. Jordan thus depends for 70% on virtual water from abroad, Djibouti
for more than 90%. Figure below shows the regions of the world according to
their blue water resources or needs.
The water of tomorrow
| In 2050, to supply everyone with the current diet, 11,000 km3 of water per year would be needed, which is possible if deficit countries can afford to buy |
| their food from exporting countries, and if they agree to produce beyond their own needs. If meat consumption accelerates, it will take 13,000 km3/year. Meat consumption has a very large effect on water requirements: 13,000 litres of water are required to produce 1 kg of grain-fed beef, which is 13 times more than for 1 kg of wheat! These 11,000 to 13,000 km3/year will be divided between rainfed and irrigated agriculture: we will have to increase yields and cultivated areas everywhere. But who says more rainfed agriculture ditch clearance and who says more irrigation ditch dam construction? The construction of dams or clearing will necessarily have harmful environmental consequences, but if the world’s population continues to grow, should we not try to feed it in the least harmful way possible? Seawater desalination has a cost of about 0.7 €/m3, and an |
electricity consumption of 2 to 4 kWh/m3 : this is about ten times too much for irrigation water, but acceptable for domestic water.
Some probable action plans ( not exhaustive) to soften the colour contrast in the forecast for 2050:
| Reduce the use of fresh water for avoidable purposes like gardening, washing, irrigation, etc., Focus on non-water intensive crops for agriculture, sensitise, motivate with special concessions |
| Change dietary habits which consumes lesser water for the same qualitative food. Water recycling & reuse for majority of day today use. Enhanced water audit. |
References and notes
| AGRIMOND (2010) Scenarios and challenges for feeding the world in 2050. Coordinated by S. PAILLARD, S. TREYER & B. DORIN. Editions Quae, Versailles, 295 p. DIAMOND, J. (2006) Collapse. How societies decide on their disappearance or survival. Gallimard, Paris, 648 p. (Translated from the English, “Collapse”, Viking Penguin, 2005). DÖLL, P., MÜLLER SCHMIED, H., SCHUH, C., PORTMAN, F.T., EICKER, A. (2014) Global-scale assessment of groundwater depletion and related groundwater abstractions: combining hydrological modeling with information from well observations and GRACE satellites. Water Resour Res. doi:10.1002/2014WR015595 GERLAND P., RAFTERY A., SEVCIKOVA H., LI N., GU D., SPOORENBERG T., ALKEMA L., FOSDICK B., CHUNN J., LALIC N., BAY G., BUETTNER T., HEILIG G. & WILMOTH J. (2014) World population stabilization unlikely this century. Science, 346 : 234-237 ; doi: 10.1126/science.1257469. GLEICK, P.H. (2014) Water, Drought, Climate Change, and Conflict in Syria. Wea. Climate Soc., 6, 331-340; doi: http://dx.doi.org/10.1175/WCAS-D-13-00059.1. GRIFFON M. (2006) Feeding the planet. Odile Jacob, Paris: 456 p. HOEKSTRA, A., M. MEKONNEN (2012) The water footprint of humanity. Proceedings of the National Academy of Sciences of the USA. www.pnas.org/cgi/doi/10.1073/pnas.1109936109 IWMI (INTERNATIONAL WATER MANAGEMENT INSTITUTE) (2007) Water for Food, Water for Life: the Comprehensive Assessment of Water Management in Agriculture. D. Molton (ed.), Earthscan, London, UK, 645 p. LERIDON, H., MARSILY G. de, coord. (2011) Demography, climate and global food supply. EDP Sciences – Report of the Académie des Sciences, Paris, 313 p. (and www.academie-sciences.fr) LIZUMI, T., LUO, J., CHALLINOR, A., SAKURAI, G., YOKOZAWA, M., SAKUMA, H., BROWN, M., YAMAGATA, T. (2014) Impacts of El Niño southern oscillation on the global yields of major crops. Nat Commun 5:3712. doi:10.1038/ncomms4712 MARSILY, G. de (2006) Les Eaux Continentales. EDP Sciences, Report of the Académie des Sciences, Paris, 328 p. (and www.academie-sciences.fr) |
| MARSILY, G. de (2015a) Water, a coveted renewable resource and unequally distributed. Ann. Northern Geol. Soc. T. 22 (2nd series), December 2015. MARSILY, G. de, ABARCA DEL RIO, R. (2015b) Water and Food in the 21st Century. Surveys in Geophysics, v.36, n°4, July 2015, DOI 10.1007/s10712-015-9335. ORTLIEB, L. (2000) The documented historical period of El Niño events in Peru: an update of the Quinn record (16th to 19th centuries). In: DIAZ H.F. & MARKGRAF V. eds, El Niño and the southernoscillation. Multiscale variability and local and regional impacts. Cambridge University Press: 496 p. ROJAS, O., LI, Y., CUMANI, R. (2014) Understanding the drought impact of El Niño on the global agricultural areas: an assessment using FAO’s Agricultural Stress Index (ASI), FAO, Climate, energy and tenure division (nRc) publications. ISBN: 978-92-5-108671-1, ISSN 2071-0992 SEN, A., DRÈZE, J. (1999) Omnibus. Oxford University Press, New Delhi (India): 945 p WELZER, H. (2012) Climate Wars: what people will be killed for in the 21st century. Wiley. ISBN: 978-0-7456-5145-3By <a href="//commons.wikimedia.org/wiki/User:Sampa" title="User:Sampa">Sampa</a> – <span class="int-own-work" lang="en">Own work</span>, <a href=”https://creativecommons.org/licenses/by-sa/4.0″ title=”Creative Commons Attribution-Share Alike 4.0″>CC BY-SA 4.0</a>, <a href=”https://commons.wikimedia.org/w/index.php?curid=64801054″>Link</a> global water depletion statistics |
About Author

Mr. Kumar Sarangapani, Managing Partner Varaha Pipeline Engineering & Business Solutions LLP & Marine Specialist Project Consultant (RO) for community plants developed by Government Projects in Tamilnadu, Andra Pradesh, Maharashtra & Gujarat.
Kumar is”chemical engineer with about 40 years of experience.
Twitter– KumarSarangapa1