In Part-2: Investors Vs. Traders information were shared on the stock that have high weightage in Sensex, Nifty50 & Bank Nifty, Buying and Selling by FII & DII and the +ve / -ve return for some of the key stocks in last one year.
Many of us know about the Law of Conservation of Energy:
“Energy neither can be created nor Destroyed. It changes one form to other”
Synonymous to that for Stock Market is:
“Money neither can be increased or decreased. It only changes Hands”.
Someone Gain is another person Loss. All can-not be gainers.
Trading in stock market is also synonymous to any kind of betting where the players are gainers & losers. Like any legalise betting agencies viz. Lottery, Casino, online gambling, club houses etc. where organisers have their cut, Brokers, Stock Exchange, Government & other agencies have their cut on Buying & Selling of Shares on traded amount.
Stocks and Indices (Nifty50 and Bank Nifty) are traded every day on BSE and NSE. Trading is full time business and many Broker Houses, D-Mat account bankers, FII, DII, specialists and professional are engaged in every trading setting the tone whereas traders are “Playing Along” with them on speculation.
Trading in Stock Market gives ample opportunity for making quick money every day. However, the same is not easy. As stated above, Trading is a full-time business and is not suggested for casual traders and requires deep knowledge of Fundamental, Technical Charts, Open Interest, Volumes & many other parameters vital for trading.
The factors that affects intraday trading is dependent on various events, news, global market, oil & currency prices etc. Fundamental & Technical chart specialists and those engaged in stock market trading speculate the market & stock trend analysing the data built-up on the previous days, technical charts, and company performance etc. However, the dynamics of market is difficult to be understood as the best of experts goes wrong on many of their analysis.
If anyone intends to indulge in trading or is doing trading, it is suggested to learn and understand Analytical & Technical charts, importance of Open Interest (OI) /VIX/PCR. Some of the key terms used in stock market trading are listed below for information.
VIX: India VIX is a volatility index based on the NIFTY Index Option prices. From the best bid-ask prices of NIFTY Options contracts, a volatility figure (%) is calculated which indicates the expected market volatility over the next 30 calendar days.
Put Call Ratio (PCR): Put/Call ratio (PCR) is a popular derivative indicator, specifically designed to help traders gauge the overall sentiment(mood) of the market. The ratio is calculated either on the basis of options trading volumes or on the basis of the open interest for a particular period
Open Interest: The no. of shares that are outstanding & traded for the Stock, Indices.
Change in Open Interest: The no. of shares added or reduced during the intraday trading
Volumes: No. of shares traded (Buy or Sell) at a particular price.
Long Position: First Buying call and Selling Later to close the position.
Short Position: First Selling and Buying Later to close the position.
Long Unwinding: Close out position of Long (Buy), i.e Selling the stocks to exit the long position.
Short Covering: Close out position of Short (Sell), i.e Buying back the stocks to exit the short position.
(Short means shares buy and sell it quickly it is called as short-term stocks.)
Technical Charts and data analysis help to speculate the trend but the trend may have unexpected move by heavy buying or selling.
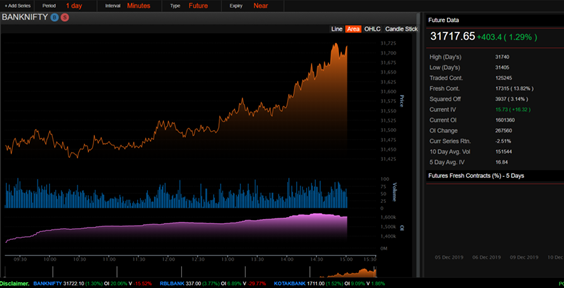
Daily Charts (Ref. ICICI Direct): These Charts are formed on screen during the trading and can be seen with all data real time
Analytical Charts (Ref. Money Control): Analytical charts are formed on screen on instant trading as the trading progresses. These charts also give data on open interest, change in open interest, volumes etc. Charts have all the historic trends of stock performance up to 5-yrs.

TECHNICAL CHARTS (Ref. Money Control): These charts give information on volumes traded and Range (High-Low) on date of trading. Green and Red are indicative of losing & gaining during the day from previous day.

Stock prices increase or decrease is a factor of demand & supply during trading and positions being created for trading. Stocks are traded in cash market, Future, and Options. All the listed stocks with BSE and NSE can be traded in cash market. However, stocks listed in F&O segments and Indices can be traded only in Future and Options.
Margin Buy or Margin Sell: All stocks listed with BSE and NSE can be traded in cash market by creating a margin on the no. of shares intend to be traded. Margin value depends upon the no. of shares, value of stock & its volatility. While “Margin Buy” can be traded in “Client Mode” or “Brokers Mode,” “Margin Sell” are traded in “Brokers Mode”. Trades in Brokers Mode are squared up by 3.15PM automatically as per the spot price if position is not closed by traders. In Both Modes Stocks can be “Converted to Delivery” for your portfolio. For Margin Buy in Client Mode one can maintain the position for specified days as per BSE & NSE policy by maintaining the required margin. A specified interest is charged by the Brokers for the traded amount on the open position maintained.
Future & Options: Trading of Listed Stocks in F&O segments and Indices can be traded either in “Future” or in “Options” and traded on selected Contract for the Specified Period. Future Contracts are for 3-months (Current + 2months). F&O stocks and Indices are traded on “LOT” basis as specified for respective stock and Indices. Trading in F&O can be for Intraday or positional basis till the expiry of selected contract. A specified Margin is maintained while trading for Intraday and for positional trades. Margins for future can also be created by blocking the shares as per De-mat account. However, margins for “Options” are created by allocating funds from the D-mat connected accounts.
How much money one can make by trading in various modes?
How much margin is required in Margin, Future and Options?
How to select Strike Price while trading in Options?
What are the possible risks in intraday or positional trades?
How to learn trading by creating “Virtual Accounts”?
The above will be illustrated with some of the examples for the market position in last week i.e. 9Th Dec’2019 to 13Th Dec’2019 and earlier events in Part-B of this segment.
To Continue: Stock Market Part 3B: Trading (Examples)- Future Vs. Options
_____________________________________________
BY JAGDISH SETHI (IIT ROORKE)
A “Project Management Consultant” with over 43-year experience has worked on numerous projects in diverse field (Atomic Power Projects, Chemical & Fertilisers, Food and Pharmaceuticals). Last 16 years executed large EPC project for Water Management as Project Director associated with EPC companies.
Twitter Handle: Jagdish Sethi @jcsethi