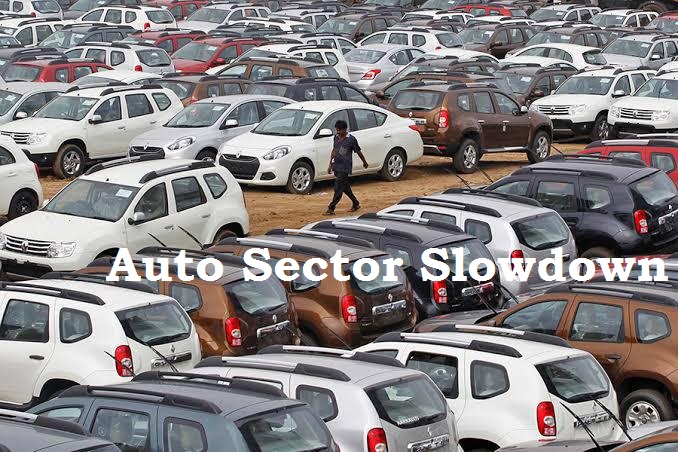
The current slowdown in the auto industry especially the 2Ws and the 4Ws space is a point of concern for many. But a closer look at the slowdown in terms of the ground level numbers leads us to many questions; the most important one being, is this slowdown cyclical or structural? I will be concentrating only on the 2Ws and 4W numbers and not on tractors, bicycles and 3Ws which act as personal transport vehicles in the rural parts of the country.
The Auto Volume & Population
To give you a context, Indian domestic personal mobility space comprises of ~85% 2Ws and ~15% 4Ws in terms of volume and India’s population density is high at 411/km2 when compared to some significant counterparts like China (147/ km2);U.S(35/Km), Japan (337/Km), U.K (276/Km), Germany (233/Km) (source: World Population Review). Given this population density, the distance travelled by an individual within the country goes down significantly as most places to commute are located close by (10-15kms). All these characteristics which are unique to India makes the comparison of “per capita car” potential of cars with the U.S, China or any country in Europe very imprudent.
In 2015, the number of cars in India/1000 people was ~22 and given that car sales volume has grown by ~6.7% CAGR (over FY14-FY19) we can conservatively assume that this number would have crept up to ~27/1000ppl (EY report says this number is at ~34/1000). Adding to this, the number of 2Ws in India/1000 people was ~85 in 2015, given that the 2W sales volume have grown by ~7.4% CAGR (over FY14-FY19) which we can assume to have gone up to ~110/1000ppl. This gives a total of ~137/1000ppl of 2Ws and 4Ws); to get a perspective, ~8 to 10Years of sales volume can be considered actively running vehicles in the country, which results in a volume of ~18 to 19crore vehicles (2Ws and 4Ws). Added to this the house hold size in India is ~4.5 persons (reduced from 4.8 due to urbanization, source: DHS) which means that we have ~30crore HHs with ~19crore personal mobility vehicles, which would be 0.63 vehicles/HH. If we remove the shared-mobility vehicles (Ola, Uber and other local and inter-state transport vehicles), which would be ~12% of the PVs we might have an ownership of 0.61 vehicles/HH. Also, in most cases the yellow-board cabs are used as personally transport vehicles as well, so this adjustment would not have a material impact.
So, assuming we have ~19crore vehicles on the road with an average lifespan of ~10years the yearly replacement demand for 2W and 4Ws alone could be ~1.9crore vehicles with ~85% being 2W and ~15% being PVs. In FY19 the industry has hit a volume of ~2.4crore vehicles, which indicates a new demand of 50lakh to 60lakh vehicles/year. The yearly increase in the automobile sales depends on the replacement demand as well as the fresh demand.
Household Leverage & Consumption
The story of the HH leverage & savings do not paint a pretty picture. The industry has sold ~11crore vehicles in the last 5 years and ~50% of the personal transport vehicles are financed in India. Assuming 45K as on-road price for a 2W and 4lakhs as on-road for a 4W and at 80% funding, the total leverage added over the last 5 years have been ~4.1Lakh crores. This entitles a monthly EMI of $1000 to 2.5K for 2W and 7.5 to 8K for 4W at a borrowing rate of ~10.5% for a 3 to 4-year loan. This translates to a yearly EMI of ~11K on a 2W loan and ~98K on a 4W loan.
Looking at the macro level and HH data from RBI over the time period (FY15-FY19):
The HH financial liabilities for FY18 stood at ~7.4Lakh crores and as per current estimates this would be ~8.5Lakh crores in FY19; this has grown at the rate of 25% over the last 4 years
The savings has grown at a slower pace of ~14% which as a % of GDP has fallen from 19.6% of the GDP to 17.2%. It needs to be noted that this savings as a % of GDP was at ~23.6% in FY12
During the same time period, the per capita PFCE (Private Final Consumption Expenditure) which acts a proxy for HH consumption spending has grown at a much slower pace of ~11% to ~INR83,634
The above macro and HH data points direct us towards the conclusion that the increase in HH leverage and reduction in HH savings (as a % of GDP) has led to a slower growth in the HH consumption spending which could have impacted the volumes
Connecting the dots
The slowdown in the personal transportation segment passenger vehicles and 2Ws is a combination of rise in the ownership of vehicles, increase in the leverage and drop in savings of HHs. Unless, the savings level as a % of GDP do not inch up to ~23% and the leverage falls to more manageable levels, the consumption spending would continue to grow only at a muted pace. This would impact the fresh demand (of ~50lakh to ~60lakh units per year) more than the replacement demand as first time buyers tend to be would be more cautious. So, from the HH savings and leverage perspective the slowdown seems more cyclical. But, from an ownership perspective, it would be prudent to watch out for more (vehicle/HH) data to determine if this is a structural slowdown.
This leaves us with a few questions:
What is the optimum leverage for the HH segment up to which consumption (PFCE) can grow at a healthy pace? – in other words, what is the leverage HH can absorb? currently the leverage is high
Where would the ownership levels of the private vehicles settle at? – would it be 0.7/HH or would it be 1.5/HH
What would the impact of EVs or BS-VI be on the Automobile prices?
The other factors that are tough to quantify but are visible in the above macro numbers are: liquidity crunch amongst the dealers; advent of shared mobility and slow-down in infrastructure spending (though in my opinion this must be least important factor)
Stimulus will only postpone the problem – There is an industry-wide noise calling for a stimulus from the Central government, but any stimuli would only be a short-term fix given the above data points. Unless the saving patterns and the leverage evens out and the purchasing power returns, this slow-down will persist.
In conclusion, this does not mean that the Auto segment is not an attractive space to be in as an investor. It only means that the sector is in a state of flux with too many moving parts, which would fall in place only over the next 12 – 18 months and going forward the volume growth could be lumpier than even.

Author: Kishore Chidambaram works in the treasury dept of a major Insurance company and have got 12+ years experience in Equity Research and Asset management, can be reached on Twitter @kishoreciyer1